A Safer Way to Invest in Stocks

A Safer Way to Invest in Stocks
A test drive
To see how investing a fixed number of dollars at regular intervals demolishes risk, let’s go back in time to the end of 1928. (Congratulations on winning the Presidency, Mr. Hoover!)
From 1929 through 1938, stocks turned in their worst ten-year performance in modern history. Over those ten years, remembered for the Crash of ’29 and the Great Depression that followed, dreams of investment success turned to nightmares for many Americans.
Reggie and Joe: two hypothetical investors:
Reggie Pierpoint has just inherited $10,000, and at the end of 1928, he invests it all in stocks.
Joe Paycheck doesn’t have that kind of money. Instead, he invests $1,000 in stocks at the end of 1928. He invests another $1,000 a year later, and another $1,000 a year after that. By 1938, Joe, like Reggie, has invested a total of $10,000.
Look at their results, as measured by the S&P 500-stock index, as of the end of 1938:
• Reggie lost ground. Even with dividends reinvested, Reggie ended 1938 with less than he started. His annualized investment return? A discouraging minus 0.9%
• Joe moves ahead. Wall Street may have laid an egg, but Joe managed to make an omelet. By investing $1,000 every year, he acquired more and more stock at bargain prices. By the end of 1938, with dividends reinvested, his total investment of $10,000 was worth almost $15,000. His annualized return? A respectable 7%. Not bad under the circumstances.
The flip side
For comparison, the absolute best ten years for stocks thus far, as measured by the S&P 500, was the decade 1949-1958. Someone like Reggie who invested $10,000 at the end of 1948, and reinvested all dividends, would have piled up more than $60,000 ten years later. Someone like Joe, investing $1,000 a year, would have accumulated almost $30,000.
Most ten-year periods aren’t that good. But most aren’t as bad as 1929-1938, either.
Joe’s investment program was safer than Reggie’s because he took advantage of dollar-cost averaging.* Today’s investors who build their retirement funds by investing regular amounts on a regular schedule enjoy the same advantage. If the stock market does take a tumble—and tumbles are to be expected from time to time—these dollar-cost averagers will be able to acquire relatively more stock per dollar. Result: a larger nest egg in the long run.
“The stock market is like a gambling arena only in the short run,” writes Norman Fosback, editor-in-chief of Mutual Funds Magazine. “In the long run, stock fund investors
are invariably winners.” He must have been thinking of investors like Joe.
For less stress, dollar cost average
O.K. Suppose Great Aunt Harriet did remember you in her will. Suddenly you have, say, $24,000 to invest. You want to put your windfall in stocks for long-term growth, but you’re worried about investing that much money at “the wrong time.”
Solution: Dollar cost average. Invest $6,000 now and bank the rest. Invest another $6,000 six months from now, another $6,000 a year from now and make the last installment in 18 months.
Let’s suppose you put your money in Hypothetical Stock Fund. The price of HSF goes from $30 to $40 a share, then plummets to $20 before returning to $30 a share. If you had invested all $24,000 in HSF immediately, at $30 a share, after 18 months you would merely be breaking even. But you didn’t. You dollar cost averaged. So you’re ahead of the game:
| Amount invested | Share price | Number of shares purchased | |
| Now | $6,000 | $30 | 200 |
| Six months | $6,000 | $40 | 150 |
| 12 months | $6,000 | $20 | 300 |
| 18 months | $6,000 | $30 | 200 |
| Total invested: $24,000 | |||
| Average Price: $30 | |||
| Total shares: 850 | |||
Bottom line: You invested $24,000 at an average price of $30 per share. But dollar cost averaging allowed you to buy more shares at $20 than you bought at $40. After 18 months you own 850 shares worth a total of $25,500!
—————————————————————————————————————————————————————————————————————
We hope you found this article about “A Safer Way to Invest in Stocks” helpful. If you have questions or need expert tax or family office advice that’s refreshingly objective (we never sell investments), please contact us or visit our Family office page or our website at www.GROCO.com. Unfortunately, we no longer give advice to other tax professionals gratis.
To receive our free newsletter, contact us here.
Subscribe our YouTube Channel for more updates.
Alan Olsen, is the Host of the American Dreams Show and the Managing Partner of GROCO.com. GROCO is a premier family office and tax advisory firm located in the San Francisco Bay area serving clients all over the world.
Alan L. Olsen, CPA, Wikipedia Bio
![]()
GROCO.com is a proud sponsor of The American Dreams Show.
![]()
The American Dreams show was the brainchild of Alan Olsen, CPA, MBA. It was originally created to fill a specific need; often inexperienced entrepreneurs lacked basic information about raising capital and how to successfully start a business.
Alan sincerely wanted to respond to the many requests from aspiring entrepreneurs asking for the information and introductions they needed. But he had to find a way to help in which his venture capital clients and friends would not mind.
The American Dreams show became the solution, first as a radio show and now with YouTube videos as well. Always respectful of interview guest’s time, he’s able to give access to individuals information and inspiration previously inaccessible to the first-time entrepreneurs who need it most.
They can listen to venture capitalists and successful business people explain first-hand, how they got to where they are, how to start a company, how to overcome challenges, how they see the future evolving, opportunities, work-life balance and so much more..
American Dreams discusses many topics from some of the world’s most successful individuals about their secrets to life’s success. Topics from guest have included:
Creating purpose in life / Building a foundation for their life / Solving problems / Finding fulfillment through philanthropy and service / Becoming self-reliant / Enhancing effective leadership / Balancing family and work…

MyPaths.com (Also sponsored by GROCO) provides free access to content and world-class entrepreneurs, influencers and thought leaders’ personal success stories. To help you find your path in life to true, sustainable success & happiness. It’s mission statement:
In an increasingly complex and difficult world, we hope to help you find your personal path in life and build a strong foundation by learning how others found success and happiness. True and sustainable success and happiness are different for each one of us but possible, often despite significant challenges.
Our mission at MyPaths.com is to provide resources and firsthand accounts of how others found their paths in life, so you can do the same.
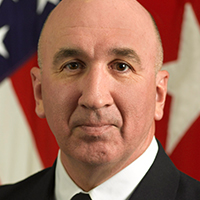
Leadership, Duty, Honor & Country With Lt. Gen. Mike Barbero
Retired US Army Lieutenant General, Michael D. Barbero, discusses leadership, service, duty, honor, and country on Alan Olsen‘s American Dreams Show. Transcript: Alan Olsen Hi, this is Alan Olsen and welcome to American Dreams. My guest today is General Michael Barbero. General, welcome to today’s show. Mike Barbero Thanks, Alan, how are you? Thanks for having me. It’s…
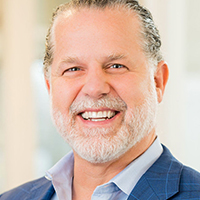
Regenerative Medicine and Creating Health with Dr. David Haase
Dr. David Haase, Founder of the MaxWell Clinic discusses regenerative medicine and creating health on Alan Olsen‘s American Dreams Show. Transcript: Alan Olsen Welcome to American Dreams. My guest today is David Haase. David, welcome to the show. David Haase Thanks, Alan. Alan Olsen So do you have a remarkable background and career obviously that…
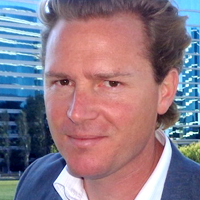
VC Success With Silicon Valley Veteran Andrew Romans
Andrew Romans, General Partner of 7BC Venture Capital, Author, and University Professor discusses navigating Silicon Valley, venture capital (VC), startup success, and the future of tech investment on Alan Olsen‘s American Dreams Show. Transcript: Alan Olsen Welcome to American Dreams. My guest today is Andrew Romans. Andrew, welcome to today’s show. Andrew Romans Thank you so…
How Entrepreneurs Shine With Gino Wickman
Gino Wickman, Founder of EOS Worldwide and author of “Shine” and “Traction: Get a Grip on Your Business” discusses How to shine as an Entrepreneur on Alan Olsen‘s American Dreams Show. Transcript: Alan Olsen Hi, this is Alan Olsen and welcome to American Dreams. My guest today is Gino Wickman. To welcome to today’s show. Gino…